|
|
Adjusted Plus-Minus: 2007-2008 Midseason resultsby Aaron Barzilai, Ph.D. and Steve Ilardi, Ph.D.Adjusted plus-minus (+/-) rating is an advanced statistical approach to estimating a player’s effect on the game while controlling for the performance of his teammates and opponents. Several articles describing the adjusted +/- statistic have appeared on 82games in recent years. Dan Rosenbaum initially outlined his approach in an influential 2004 article that analyzed the 2002-2003 and 2003-2004 seasons as a combined dataset. David Lewin then published both 2004-2005 and 2005-2006 ratings. Likewise, Steve Ilardi recently determined adjusted +/- ratings for the 2006-2007 season using a similar approach. While the previous analyses were conducted at the conclusion of a season, this article presents the first publicly available in-season computation of adjusted +/- rating. Additionally, daily updates of the 2007-2008 calculations are now available on basketballvalue.com. Adjusted +/- ratings indicate how many additional points are contributed to a team’s scoring margin by a given player in comparison to the league-average player over the span of a typical game (100 offensive and defensive possessions). These ratings are considered “adjusted” since they start with the simple +/- rating and apply a regression model as outlined by Rosenbaum to adjust for the impact of all other players on the court. All players in the top 75% in minutes during the season have been modeled, and the results have been centered so that the league-average player has an adjusted +/- value of zero. These ratings have been determined using only the matchup data available at basketballvalue.com. They do not explicitly include box score statistics, but they do reflect the value created by amassing such statistics as they contribute to a team’s net point differential. In addition, adjusted +/- ratings capture the valuable effect of myriad aspects of the game that go unrecorded in box scores, such as setting picks, boxing out, and defensive play. It is important to note that the adjusted +/- rating is not a “holy grail” statistic that perfectly captures each player’s overall value. The ratings reported here are limited by a number of factors. First, because they are estimates calculated using a complex statistical model, such ratings tend to be somewhat “noisy” with substantial estimation error unless a very large sample of games is used. In practice, even a full NBA season does not provide an adequate sample size to fully eliminate this issue. The use of only half a season’s worth of data exacerbates the problem, as indicated by the relatively high standard errors presented below. Additionally, the estimates suffer from the issue of skewed sampling – the fact that most players usually find themselves on the court in the company of certain teammates and not others. As a result, it can be difficult to accurately tease out the individual effects of two players who almost always appear on the court together. Rosenbaum and others have outlined different ways of addressing these issues, most notably using multiple years’ worth of data and augmenting regression results with additional analyses based on box score statistics. However, this article presents unaugmented adjusted +/- results determined using only the games of the 2007-2008 season through January 29th, 54% of the regular season. Despite their limitations, we believe these ratings still provide a valuable window into player performance thus far in the season. It is our hope that these results will be seen as an additional resource in the basketball community’s toolbox, along with other traditional and advanced statistics. To further enhance the value of adjusted +/- for the community, plans for future work in this area include providing an update at season’s end, calculating multi-year estimates, and determining the adjusted +/- rating of 5-man units rather than individual players. Table 1 shows the top 20 players by adjusted +/- among the players in the top 25% in minutes this season (approximately 25 minutes per game). The table also shows each player’s Net rating (On Court – Off Court), a component of the Roland Rating. Additionally, the table shows each player’s PER, as calculated by basketball-reference.com. Led by Steve Nash, 11 of the top 20 have been named to this year’s All-Star team. Among the remaining 9 are highly regarded, All-Star caliber players such as Baron Davis, Pau Gasol, Marcus Camby, and Peja Stojakovic, as well as surprises such as Jamal Crawford and Rafer Alston. However, each player’s Net Rating is positive, though not always as dramatically as Antawn Jamison’s +23.9. The “surprise” players certainly appear to be having a positive impact on their team, particularly players such as Brad Miller with a Net rating above +10.
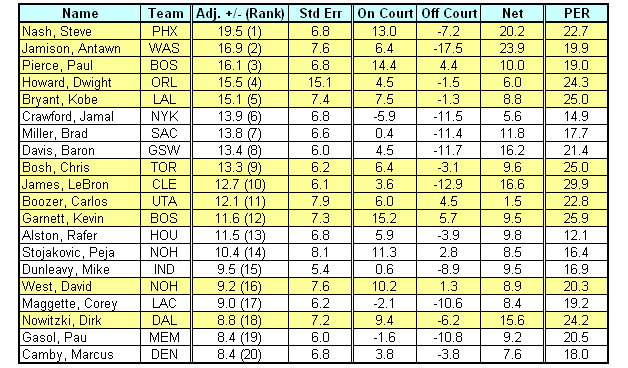
Table 1: 2008 midseason statistics, top 20 by Adjusted +/- (of top 25% in minutes) Table 2 shows the adjusted +/- of all this year’s All-Stars as well as their rank among players in the top 25% in minutes. In some cases, these players do not appear to have a net positive impact on their team as measured by either adjusted +/- or On Court – Off Court rating.
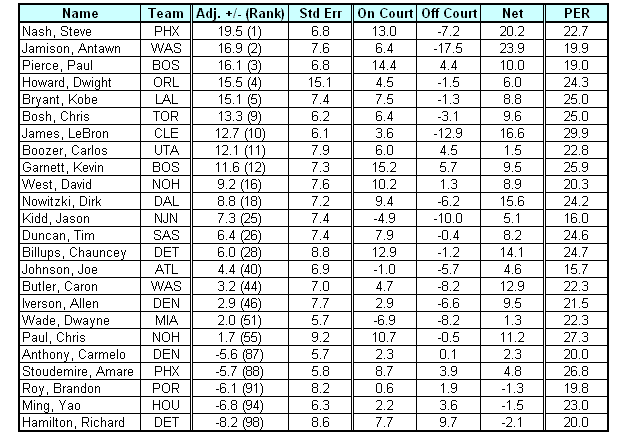
Table 2: 2008 All-Stars midseason statistics Should Steve Nash be considered the first-half MVP? We’re not prepared to argue that based solely on his adjusted +/-. All the estimates of adjusted +/- have a sizable standard error. Statistically, Nash’s rating can’t be considered significantly different from Antawn Jamison’s, Dwight Howard’s, Kobe Bryant’s, or many others, with any reasonable confidence. In our opinion, however, Nash’s very high adjusted +/- must be regarded as a data point in his favor. The ratings also highlight the strong positive impact Antawn Jamison has had for the Wizards this year. While he’s not generally mentioned as an MVP candidate, his influence is undeniable. This sort of result illustrates exactly what one would hope an advanced, non-traditional metric such as adjusted +/- can provide: highlighting performances that conventional wisdom might overlook. Tables 1 and 2 show that adjusted +/-, Net Rating, and PER rank players in different ways though all three measures are substantially correlated. Not every player who ranks in the top 10 by one of these metrics is necessarily one of the top 10 players in the league, but each metric can flag players that may be worth additional consideration. Hopefully, this article has shown that adjusted +/- ratings can help NBA teams, their fans, and the media identify hidden gems, but the results must be one piece of a broader assessment of the player.
Other 82games articles by Aaron Barzilai:
Other 82games articles by Steve Ilardi:
About the AuthorsAaron Barzilai “played” on the varsity basketball team at MIT as an undergraduate before earning his Ph.D. in Mechanical Engineering at Stanford University. He currently works as a consultant for a global consulting firm and has experience in the pharmaceutical, financial services, and online publishing industries. Aaron developed the website basketballvalue.com and would like to spend more time on basketball analytics. He can be contacted via email at webmaster@basketballvalue.com
Steve Ilardi is a professor of clinical psychology at the University of Kansas, and former statistical consultant to the KU men’s basketball team under Roy Williams. With the support of assistant coaches Jerod Haase and Ben Miller, Ilardi developed and implemented an adjusted plus-minus model of player evaluation at KU, one similar to the models independently developed by Dan Rosenbaum and Jeff Sagarin. In his ‘day job’, Ilardi is a clinical researcher who has worked to develop a novel, lifestyle-based treatment for depressive illness.
|
|
|